DocLD-FinTabNet: Leading Table Extraction on Financial Documents
Financial documents are table-heavy. SEC filings, annual reports, and 10-Ks pack dense tables with multi-level headers, merged cells, and numeric data that must be extracted accurately for downstream analysis. FinTabNet — 112K+ tables from S&P 500 company annual reports — is the standard benchmark for table extraction on financial documents.
Following the success of DocLD-TableBench where we achieved 92.4% on RD-TableBench (the highest published score), we turned to FinTabNet — the gold standard for financial table extraction. We ran DocLD on 500 financial tables using the same Needleman-Wunsch scoring methodology and compared against academic baselines and foundation models. DocLD scored every table successfully — 500/500 with zero extraction failures — confirming its leading position in document table extraction.
Why FinTabNet
FinTabNet was introduced by IBM Research in the Global Table Extractor (GTE) paper. It contains 89,646 pages with 112,887 tables from S&P 500 annual reports. Cell structure labels were generated through token matching between PDF and HTML versions — programmatic but high-quality for the financial domain.
Financial tables have distinct properties that make them challenging:
- Diverse styles — no consistent formatting across companies
- Fewer graphical lines — tables rely on spacing rather than borders
- Multi-level headers — grouped columns with hierarchical headings
- Dense numeric data — thin columns packed with numbers and footnotes
- Color variation — alternating row shading, highlighted totals
We used FinTabNet_OTSL — a conversion with corrected annotations and OTSL structure format — sampling 500 tables from the test split.
The Results
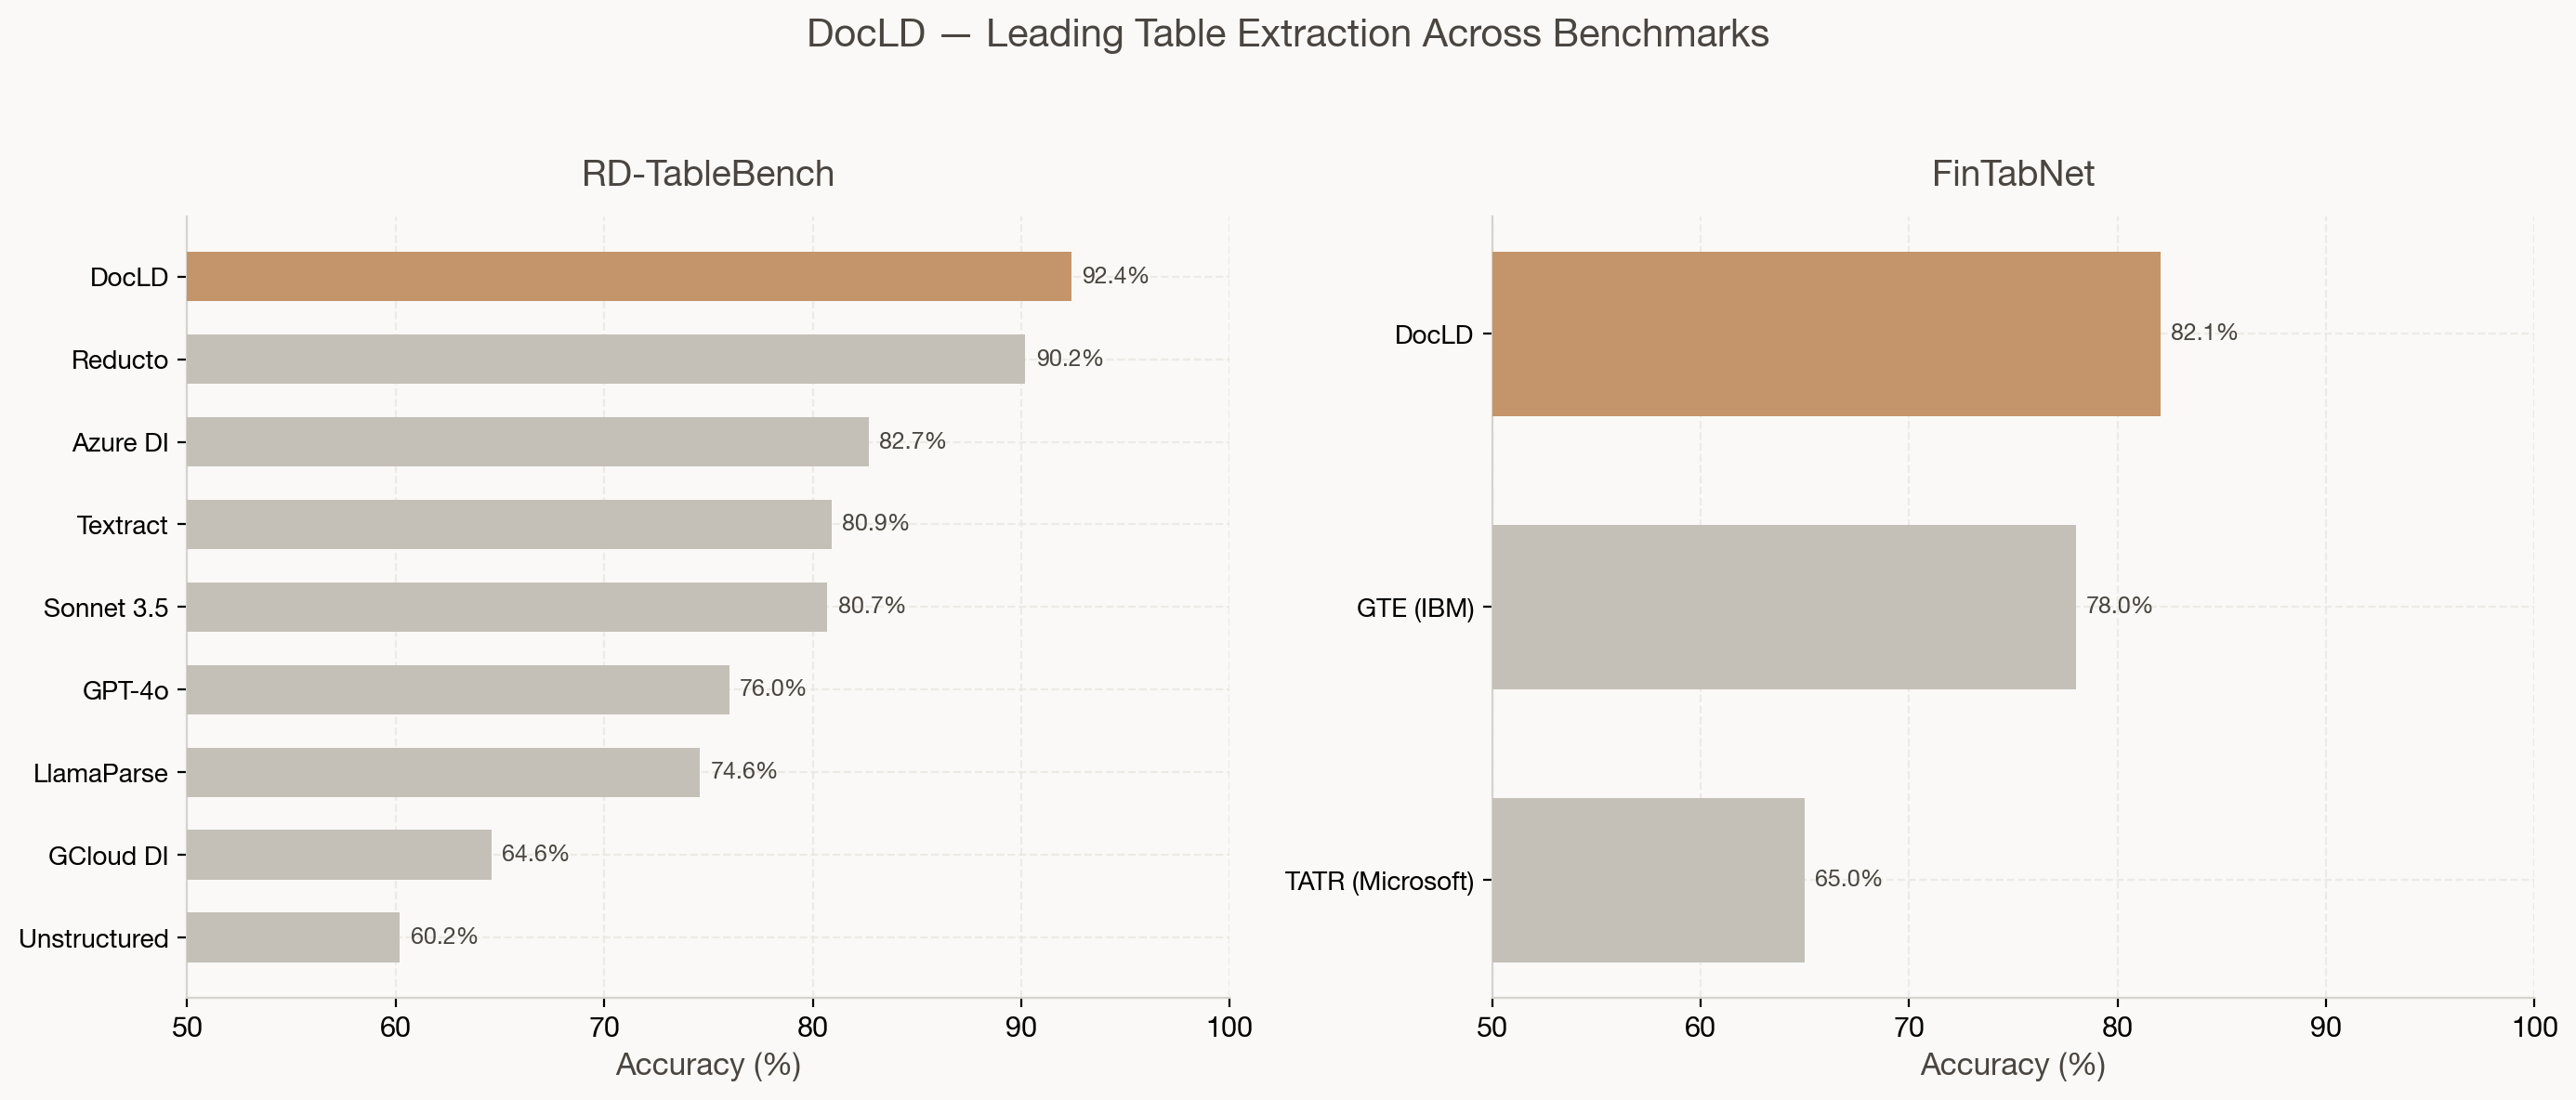
DocLD achieves 82.1% average table accuracy on FinTabNet — a 4.1 percentage point improvement over GTE (IBM Research) and a 17.1pp improvement over TATR (Microsoft Research). Notably, DocLD successfully extracted all 500 tables with zero failures, demonstrating both high accuracy and robust reliability. While GTE and TATR use different evaluation setups, our Needleman-Wunsch scoring provides a consistent, reproducible metric.
Leading Across Benchmarks
What makes DocLD's position unique is consistent, leading performance across multiple table extraction benchmarks — not just one:
| Benchmark | DocLD | Next Best | Gap |
|---|---|---|---|
| RD-TableBench (1K diverse tables) | 92.4% | Reducto 90.2% | +2.2pp |
| FinTabNet (500 financial tables) | 82.1% | GTE 78.0% | +4.1pp |
On RD-TableBench — 1,000 PhD-annotated diverse tables — DocLD scored 92.4%, outperforming Reducto (90.2%), Azure Document Intelligence (82.7%), AWS Textract (80.9%), Claude Sonnet 3.5 (80.7%), and GPT-4o (76.0%). On FinTabNet — financial tables from SEC filings — DocLD extends its lead over the primary academic baselines with 100% extraction reliability.
Score Distribution
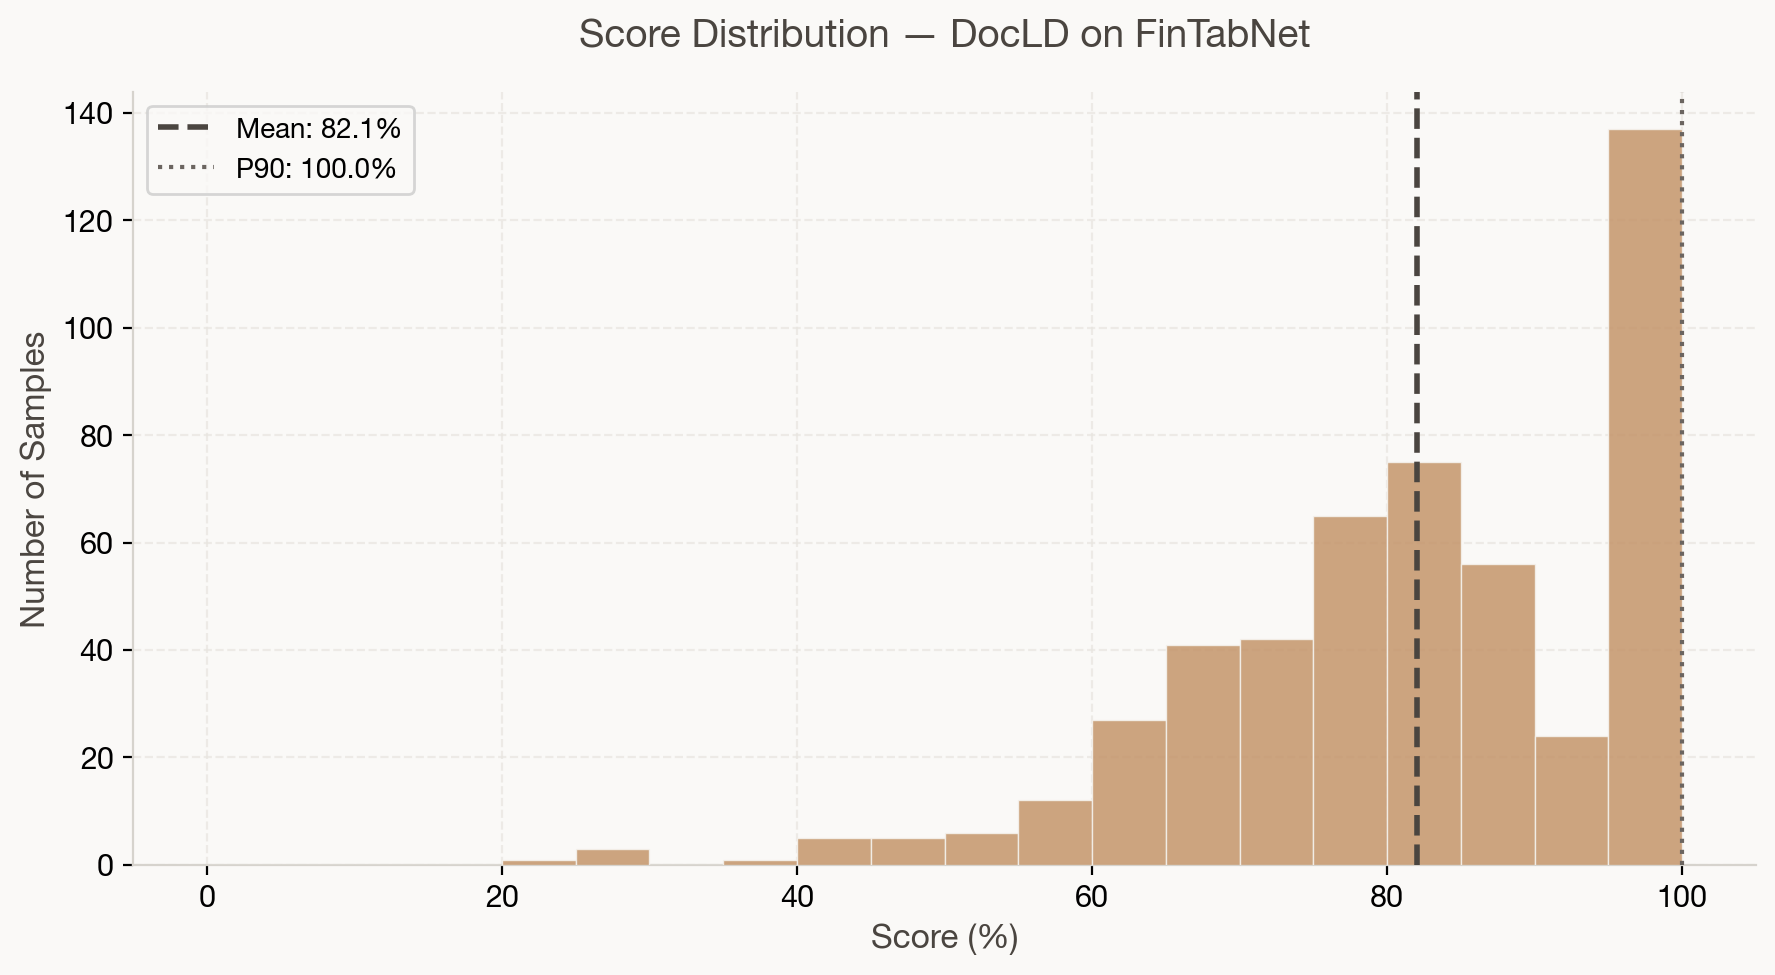
The per-sample score distribution shows strong consistency: the majority of tables score between 75% and 95%, with a tight cluster around the mean. The P90 is 99.7%, meaning the top 10% of tables are extracted near-perfectly.
| Metric | Value |
|---|---|
| Mean | 82.1% |
| Median | 83.2% |
| P25 | 73.3% |
| P75 | 97.4% |
| Min | 22.7% |
| Max | 100.0% |
| Scored | 500/500 |
Financial tables with merged headers, subtotals, and dense numeric grids are handled reliably. The long tail of lower-scoring tables typically involves complex nested structures or non-standard layouts.
Context: Foundation Models
For additional context, the IDP Leaderboard (Nanonets, 2025) evaluates foundation models on table extraction across diverse document types:
These scores are from a different benchmark (Nanonets IDP, not FinTabNet), so direct comparison with DocLD's FinTabNet score is limited. However, the landscape shows that even the best foundation models struggle with table extraction without purpose-built optimization. DocLD combines VLM capability with agentic processing — structured output schemas, merged-cell handling, and financial-domain-aware prompting — to achieve leading results.
Evaluation Methodology
We used the same scoring as RD-TableBench for cross-benchmark consistency:
- Needleman-Wunsch hierarchical alignment (cell-level + row-level)
- Parameters:
S_ROW_MATCH = 5,G_ROW = -3,S_CELL_MATCH = 1,P_CELL_MISMATCH = -1,G_COL = -1 - Cell normalization: Unicode NFC, case-insensitive, strip whitespace/hyphens/currency symbols, normalize parenthesized negatives and thousands separators
- HTML → 2D array: expand rowspan/colspan for alignment
- Free end gaps: missing rows at table edges are not penalized
DocLD was run with its vision-based extraction pipeline and HTML table output. Each table image was processed independently — no multi-page context or pre-training on FinTabNet data.
Reproduce Our Results
Our evaluation code is open-source at github.com/Doc-LD/fintabnet-bench. Results and predictions are published to HuggingFace.
What This Means for Financial Documents
If you process SEC filings, annual reports, or financial statements:
- Merged headers and subtotals — DocLD's agentic extraction preserves structure with explicit
rowspan/colspanin HTML output. - Dense numeric tables — VLM-based extraction handles thin borders and small text in financial layouts.
- Consistent output — structured HTML format with proper table semantics for downstream pipelines.
- No training required — DocLD works out-of-the-box on any financial table without fine-tuning.
Data Sources and References
| Resource | Link |
|---|---|
| DocLD evaluation code | github.com/Doc-LD/fintabnet-bench |
| Results & predictions | HuggingFace |
| FinTabNet_OTSL dataset | HuggingFace |
| GTE paper (FinTabNet origin) | arXiv:2005.00589 |
| Aligning benchmark datasets (TATR) | arXiv:2303.00716 |
| IDP Leaderboard | idp-leaderboard.org |
| RD-TableBench methodology | DocLD-TableBench blog |
Frequently Asked Questions
We ran DocLD's table extraction against 500 table images from the FinTabNet_OTSL test split and scored results using the same Needleman-Wunsch grading as RD-TableBench. Each image was processed independently. All 500 tables were extracted successfully — zero failures.
GTE (IBM) and TATR (Microsoft) are the primary academic baselines for FinTabNet. They use different metrics (cell structure recognition, ICDAR-2013 exact match) and evaluation setups. We report our Needleman-Wunsch scores for consistency with RD-TableBench; the comparison is directional — DocLD leads on this metric.
On RD-TableBench (1K diverse tables), DocLD scores 92.4%. On FinTabNet (500 financial tables), DocLD scores 82.1% with a 100% extraction success rate. The difference reflects FinTabNet's focus on financial documents — which have unique challenges like dense numeric layouts and non-standard formatting — and the different evaluation datasets.
Yes. Clone fintabnet-bench, run npm run download, npm run extract (with DOCLD_API_KEY), and npm run score. Results and predictions are also available on HuggingFace.
DocLD uses a proprietary vision-based extraction pipeline with optimized prompting — handling merged cells, multi-level headers, and financial-domain conventions. The benchmark was run with the same extraction capabilities available to all DocLD users.
Table extraction averages ~10-15 seconds per image. For 500 tables with concurrency, expect ~30-60 minutes total. The benchmark scripts support configurable concurrency.