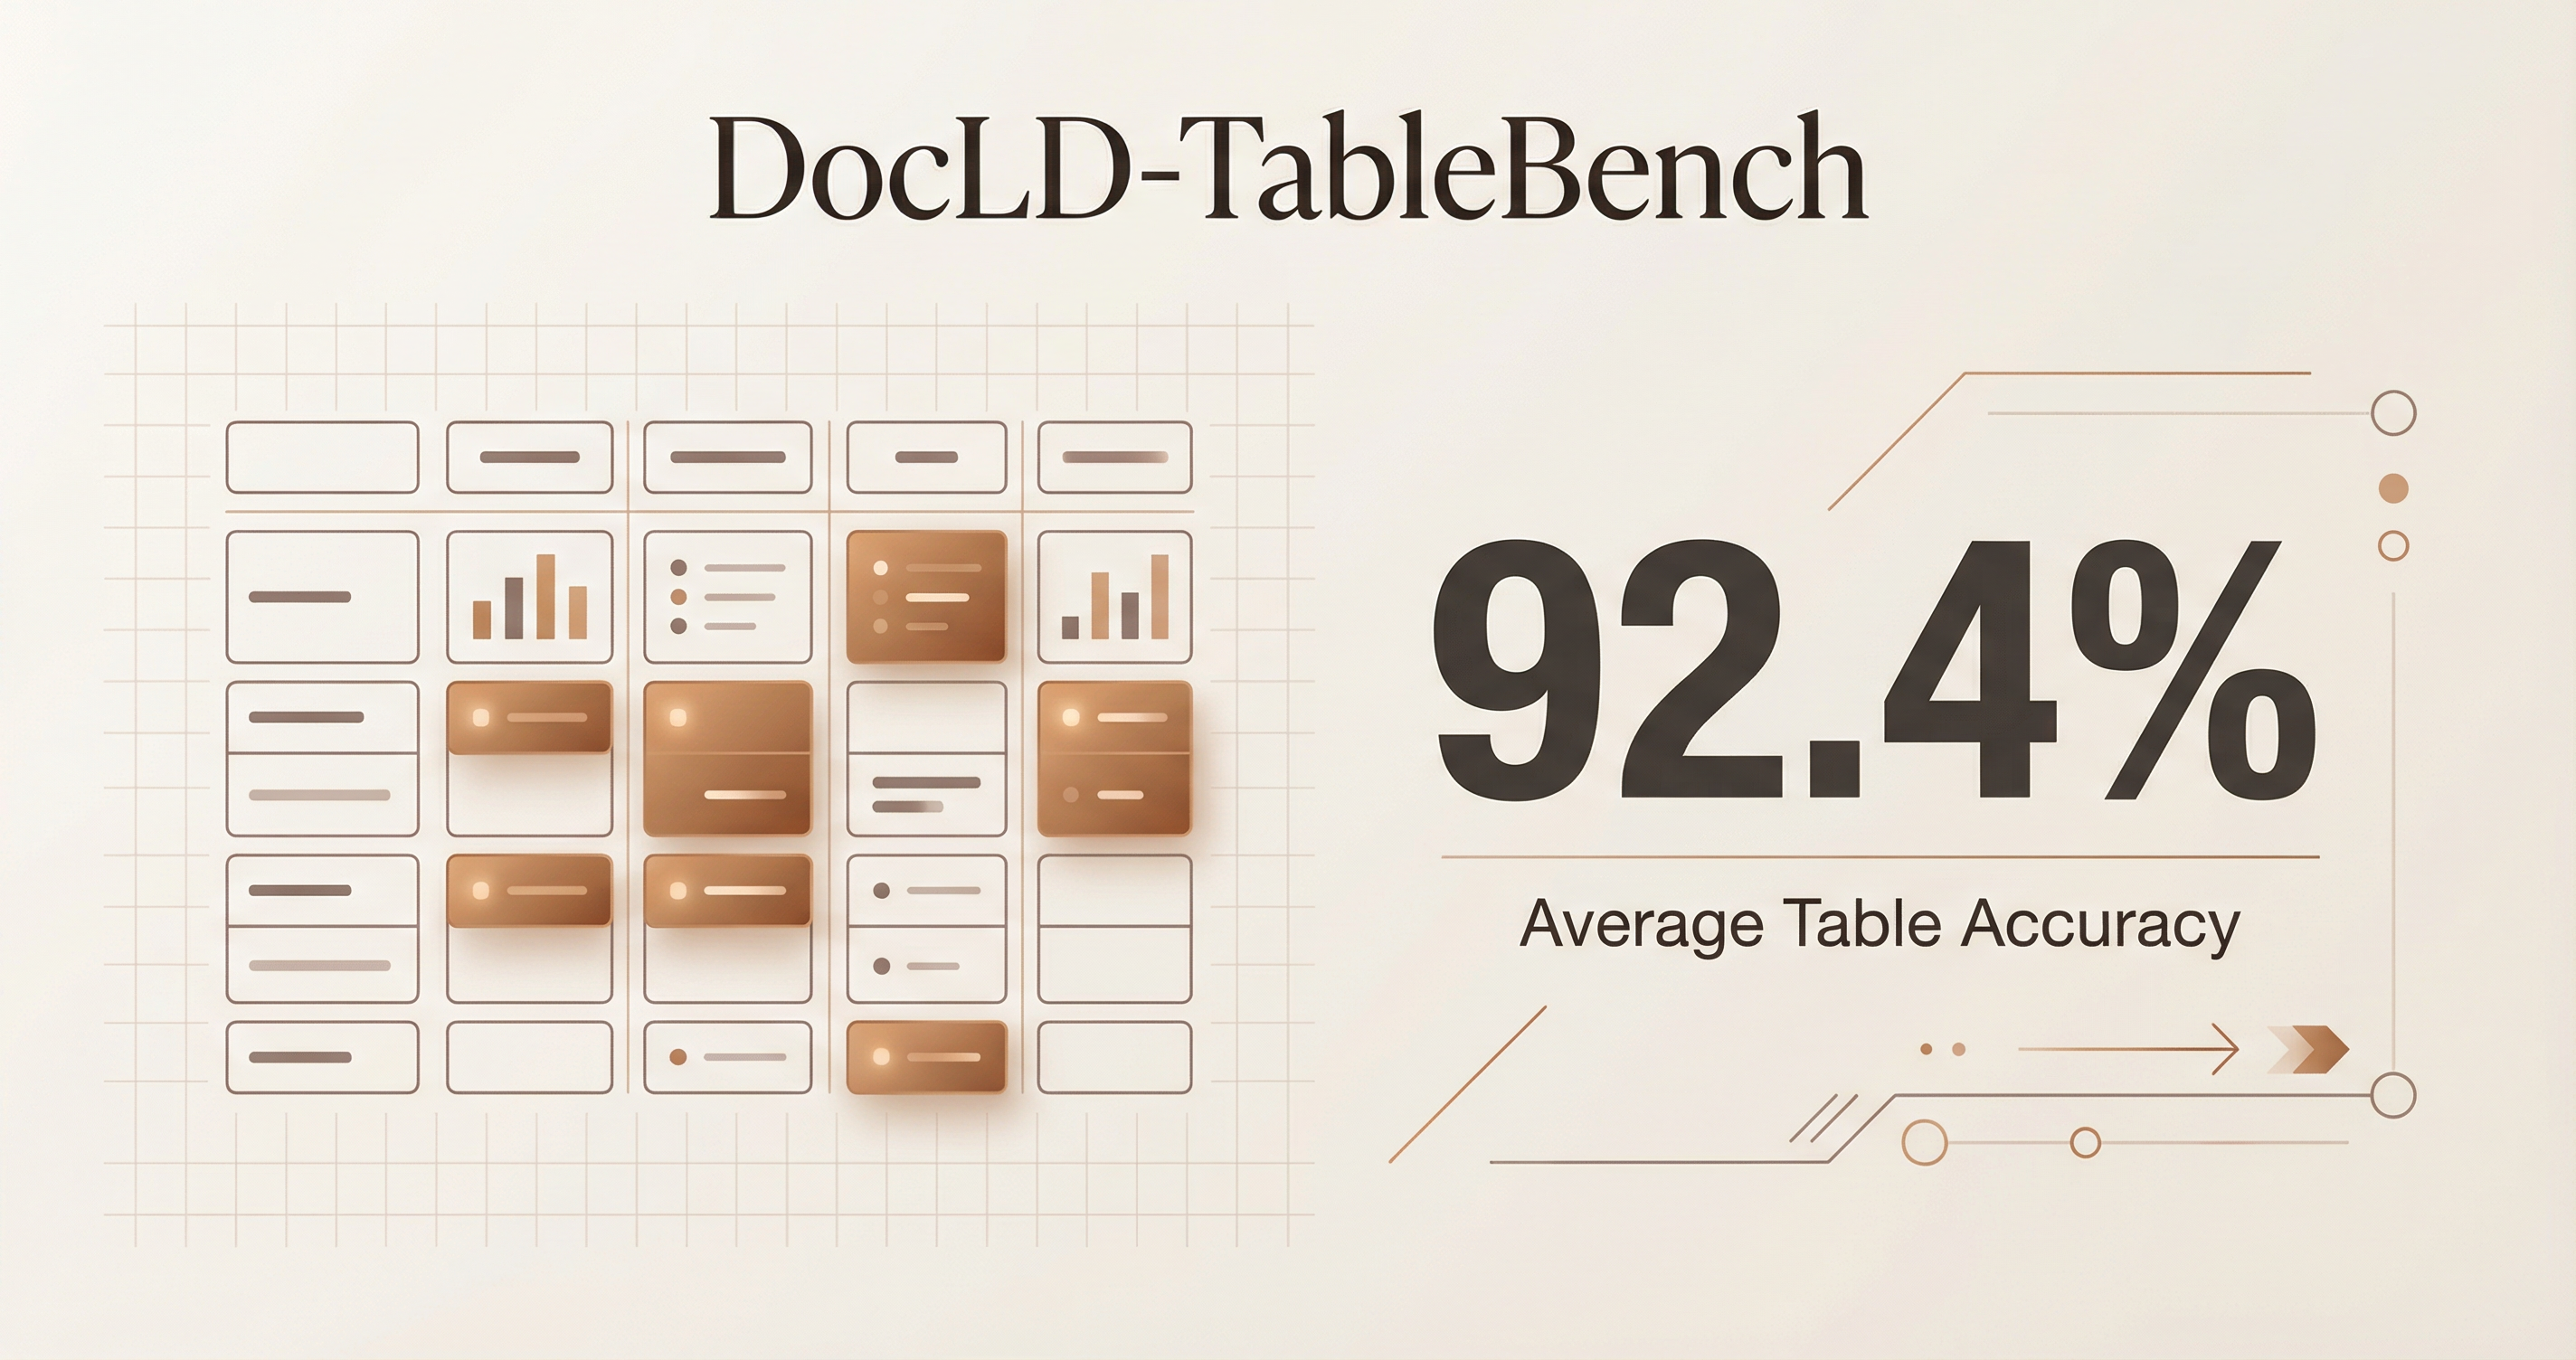
DocLD-TableBench: How We Stack Up Against the Best in Table Extraction
Tables are everywhere in the documents that drive real business processes — financial reports with multi-level headers, invoices with line-item grids, insurance claim forms mixing printed and handwritten entries, tax filings in a dozen languages, scientific papers with dense data tables spanning full pages. If you work with documents at scale, you already know: tables are deceptively hard to extract correctly. Merged cells, multi-level headers, scanned pages, handwritten entries, and dozens of languages make table parsing one of the toughest unsolved problems in document AI.
Most table extraction benchmarks test on clean, machine-generated tables — PubTabNet pulls from PubMed Central, FinTabNet from SEC filings. Both are useful but narrow. They come from a single corpus, labels are programmatically generated from file metadata, and the tables tend to follow consistent formatting conventions. Real-world tables are messier, more diverse, and far more varied in structure and language.
That's why Reducto's RD-TableBench caught our attention. It's an open benchmark of 1,000 complex tables manually annotated by PhD-level human labelers, sourced from diverse, publicly available documents. Scanned tables, handwriting, merged cells, multilingual content — exactly the kind of data our customers throw at us every day.
We decided to put DocLD to the test. Not with our own benchmark, not with cherry-picked examples — with Reducto's own data, Reducto's own grading code, and the exact same methodology they used to evaluate every other provider. The results speak for themselves.
Why We Used Reducto's Own Benchmark
When you benchmark yourself against your own data, skepticism is warranted. When you benchmark yourself against a competitor's data, using their grading code, their scoring parameters, and their evaluation methodology — and you still come out ahead — the result is much harder to dismiss.
Reducto built RD-TableBench and released it publicly in November 2024. They designed the dataset, hired the labelers, defined the scoring methodology, and evaluated seven other tools against it. Their published results showed Reducto at 90.2% — the best score at the time, ahead of Azure Document Intelligence (82.7%), AWS Textract (80.9%), Claude Sonnet 3.5 (80.7%), GPT-4o (76.0%), LlamaParse (74.6%), Google Cloud Document AI (64.6%), and Unstructured (60.2%).
We used every piece of their evaluation framework:
- Dataset: The full RD-TableBench dataset on HuggingFace — all 1,000 annotated tables, no subset selection
- Grading code: Reducto's own grading.py implementation of the Needleman-Wunsch table similarity algorithm
- Table conversion: Their convert.py for normalizing HTML tables to 2D arrays
- Scoring parameters: The exact constants from their code —
S_ROW_MATCH = 5,G_ROW = -3,S_CELL_MATCH = 1,P_CELL_MISMATCH = -1,G_COL = -1 - Normalization: Their cell normalization (strip whitespace, newlines, hyphens) applied identically
We ported their Python grading code to TypeScript and published it as an open-source repo — you can inspect every line and validate that it produces identical results on test cases. The only thing we changed was the extraction provider — everything else is Reducto's design.
Credit where it's due: RD-TableBench is an excellent benchmark. The dataset is diverse, the annotation quality is high, and the scoring methodology is thoughtful. We're grateful that Reducto released it publicly — it gives the entire document AI community a shared yardstick for measuring real-world table extraction quality.
The Results
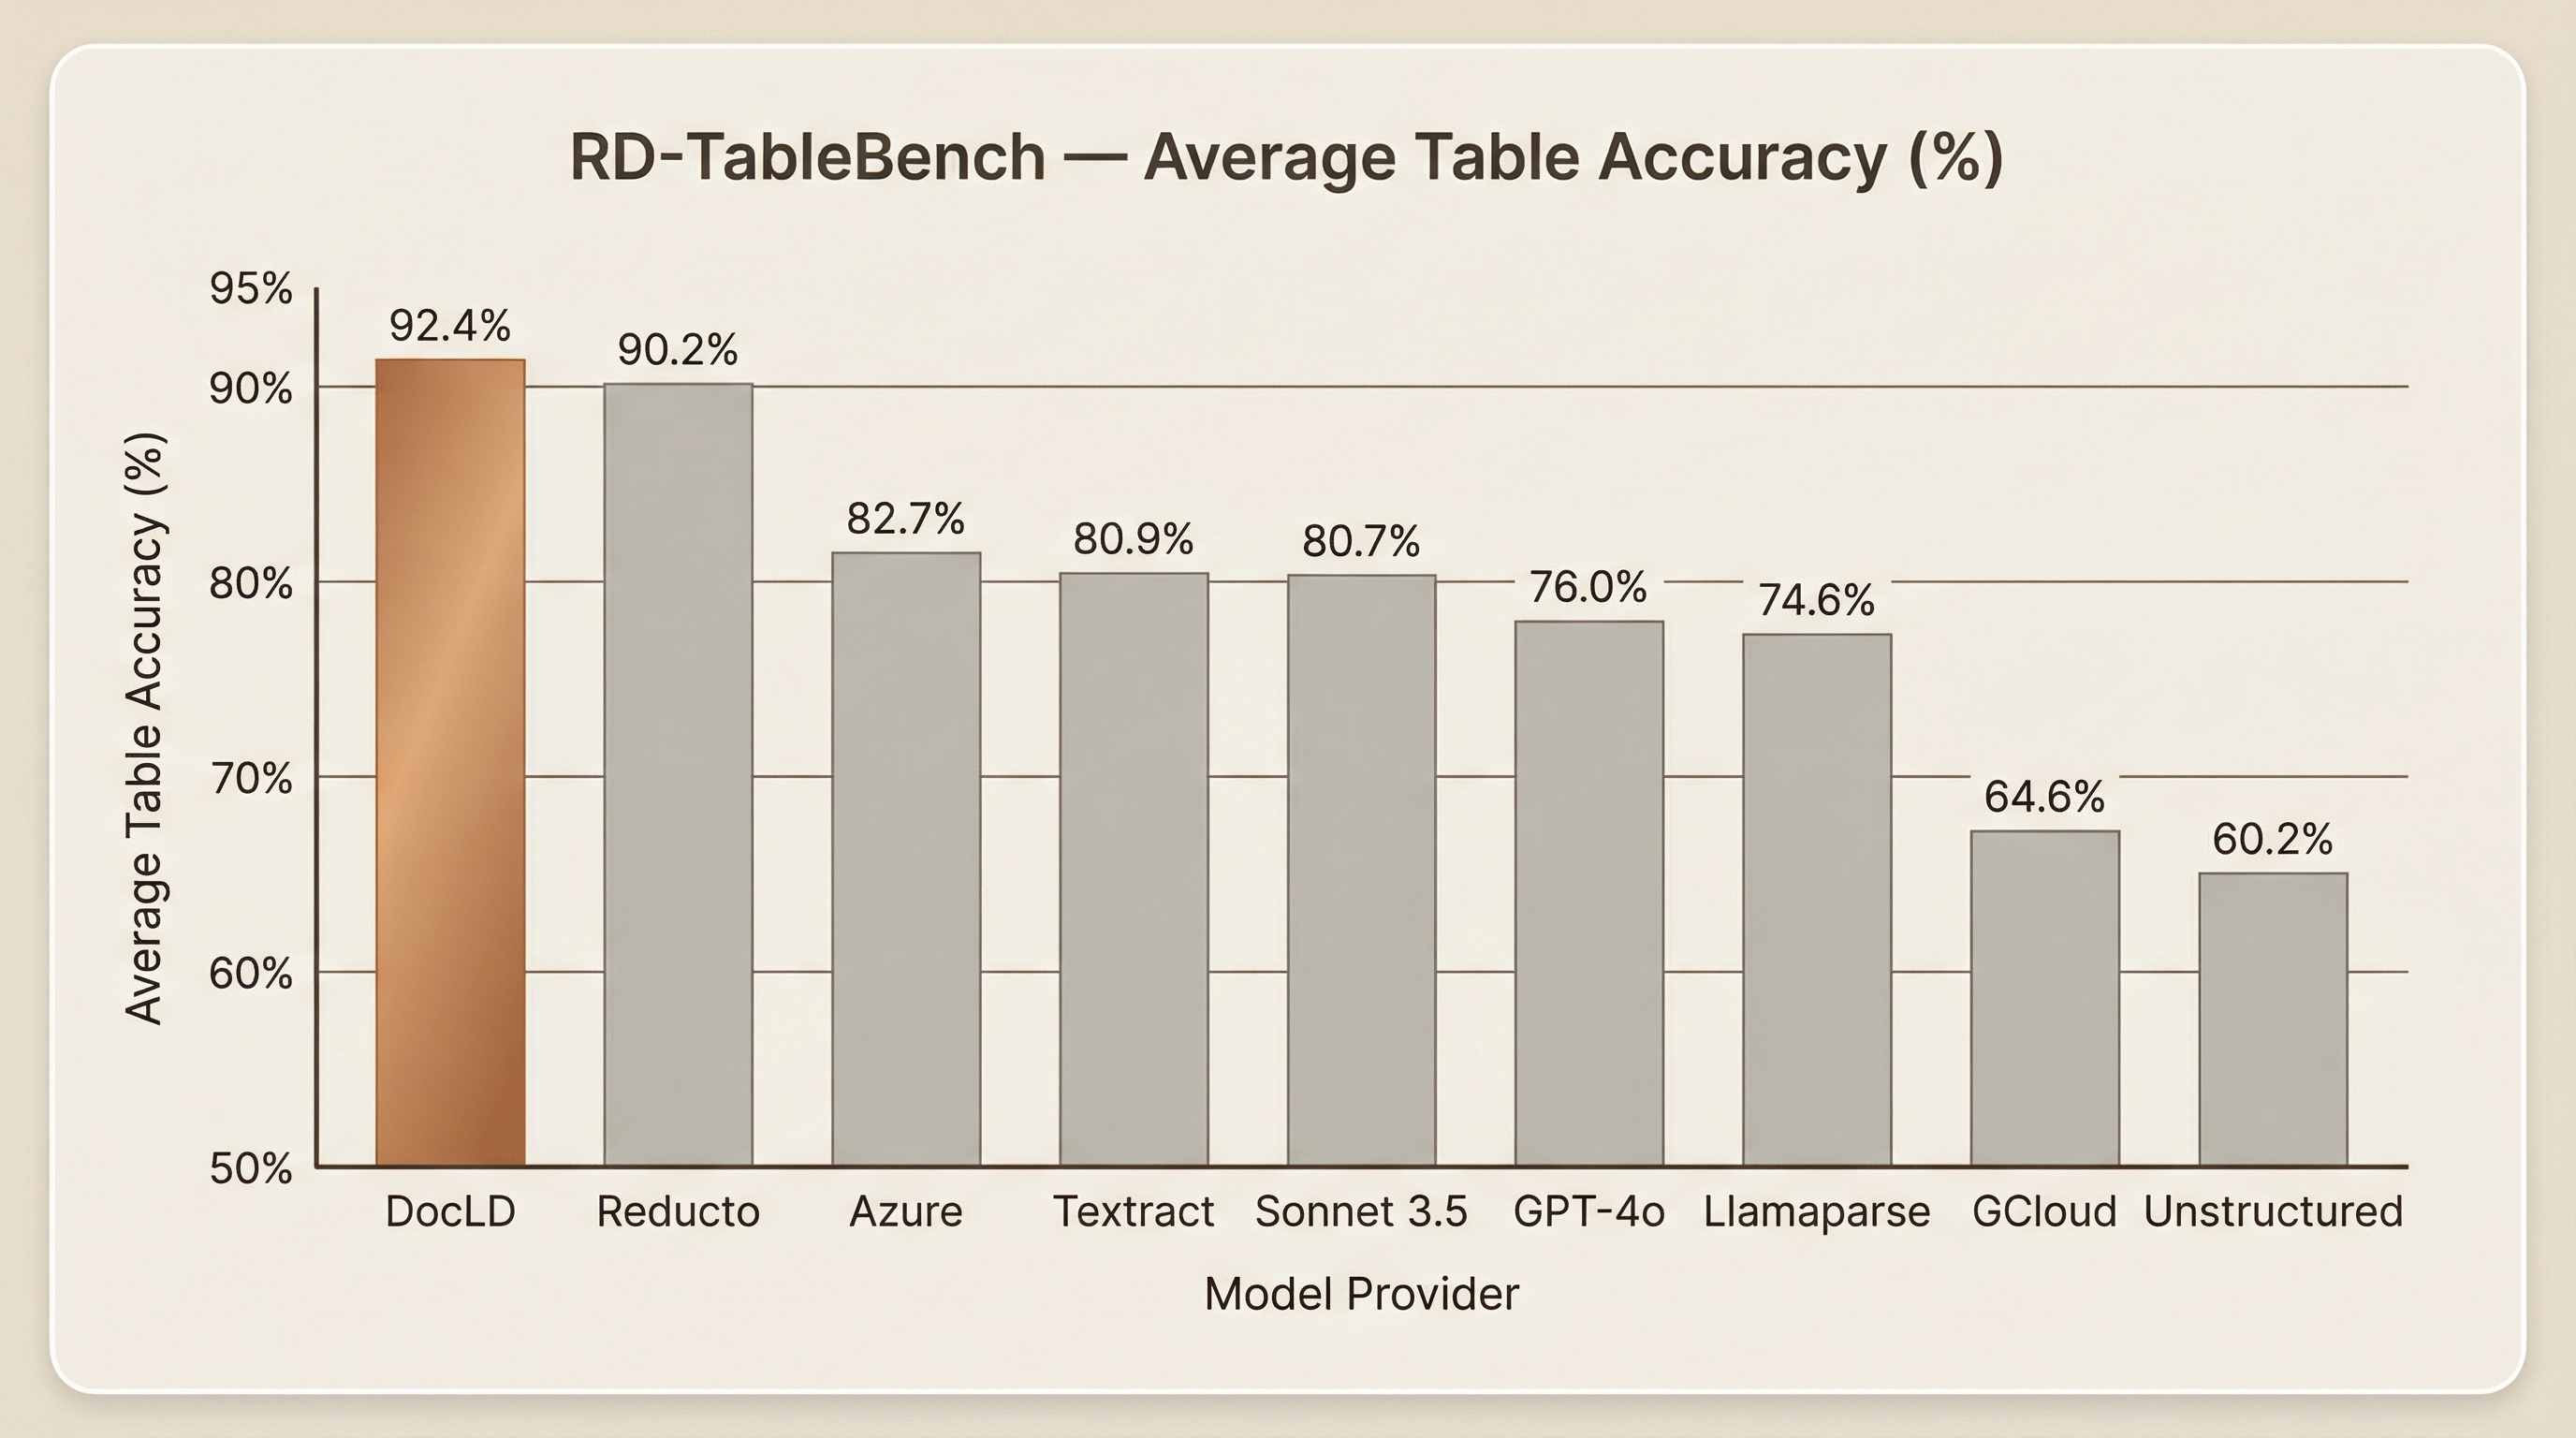
DocLD achieves 92.4% average table accuracy across all 1,000 tables — 2.2 percentage points above the previous best (Reducto at 90.2%). To put that gap in context: the difference between Reducto and the third-place Azure (82.7%) is 7.5 points. The gap between DocLD and Reducto is meaningful because it's at the top of the range where further improvement is hardest.
Competitor scores are taken directly from the published RD-TableBench results. All providers were invoked with their highest quality settings (High Res mode for Unstructured and Chunkr, Pro mode for LlamaParse). For tools without direct PDF processing ability (GPT-4o), PDFs were converted to images using poppler, exactly as described in Reducto's methodology.
About the Data
RD-TableBench was created by Reducto and released as an open dataset on HuggingFace. The dataset was designed to be difficult by construction — these aren't the clean, well-formatted tables you see in academic benchmarks. They're the ones that actually break extraction tools in production.
How the data was collected
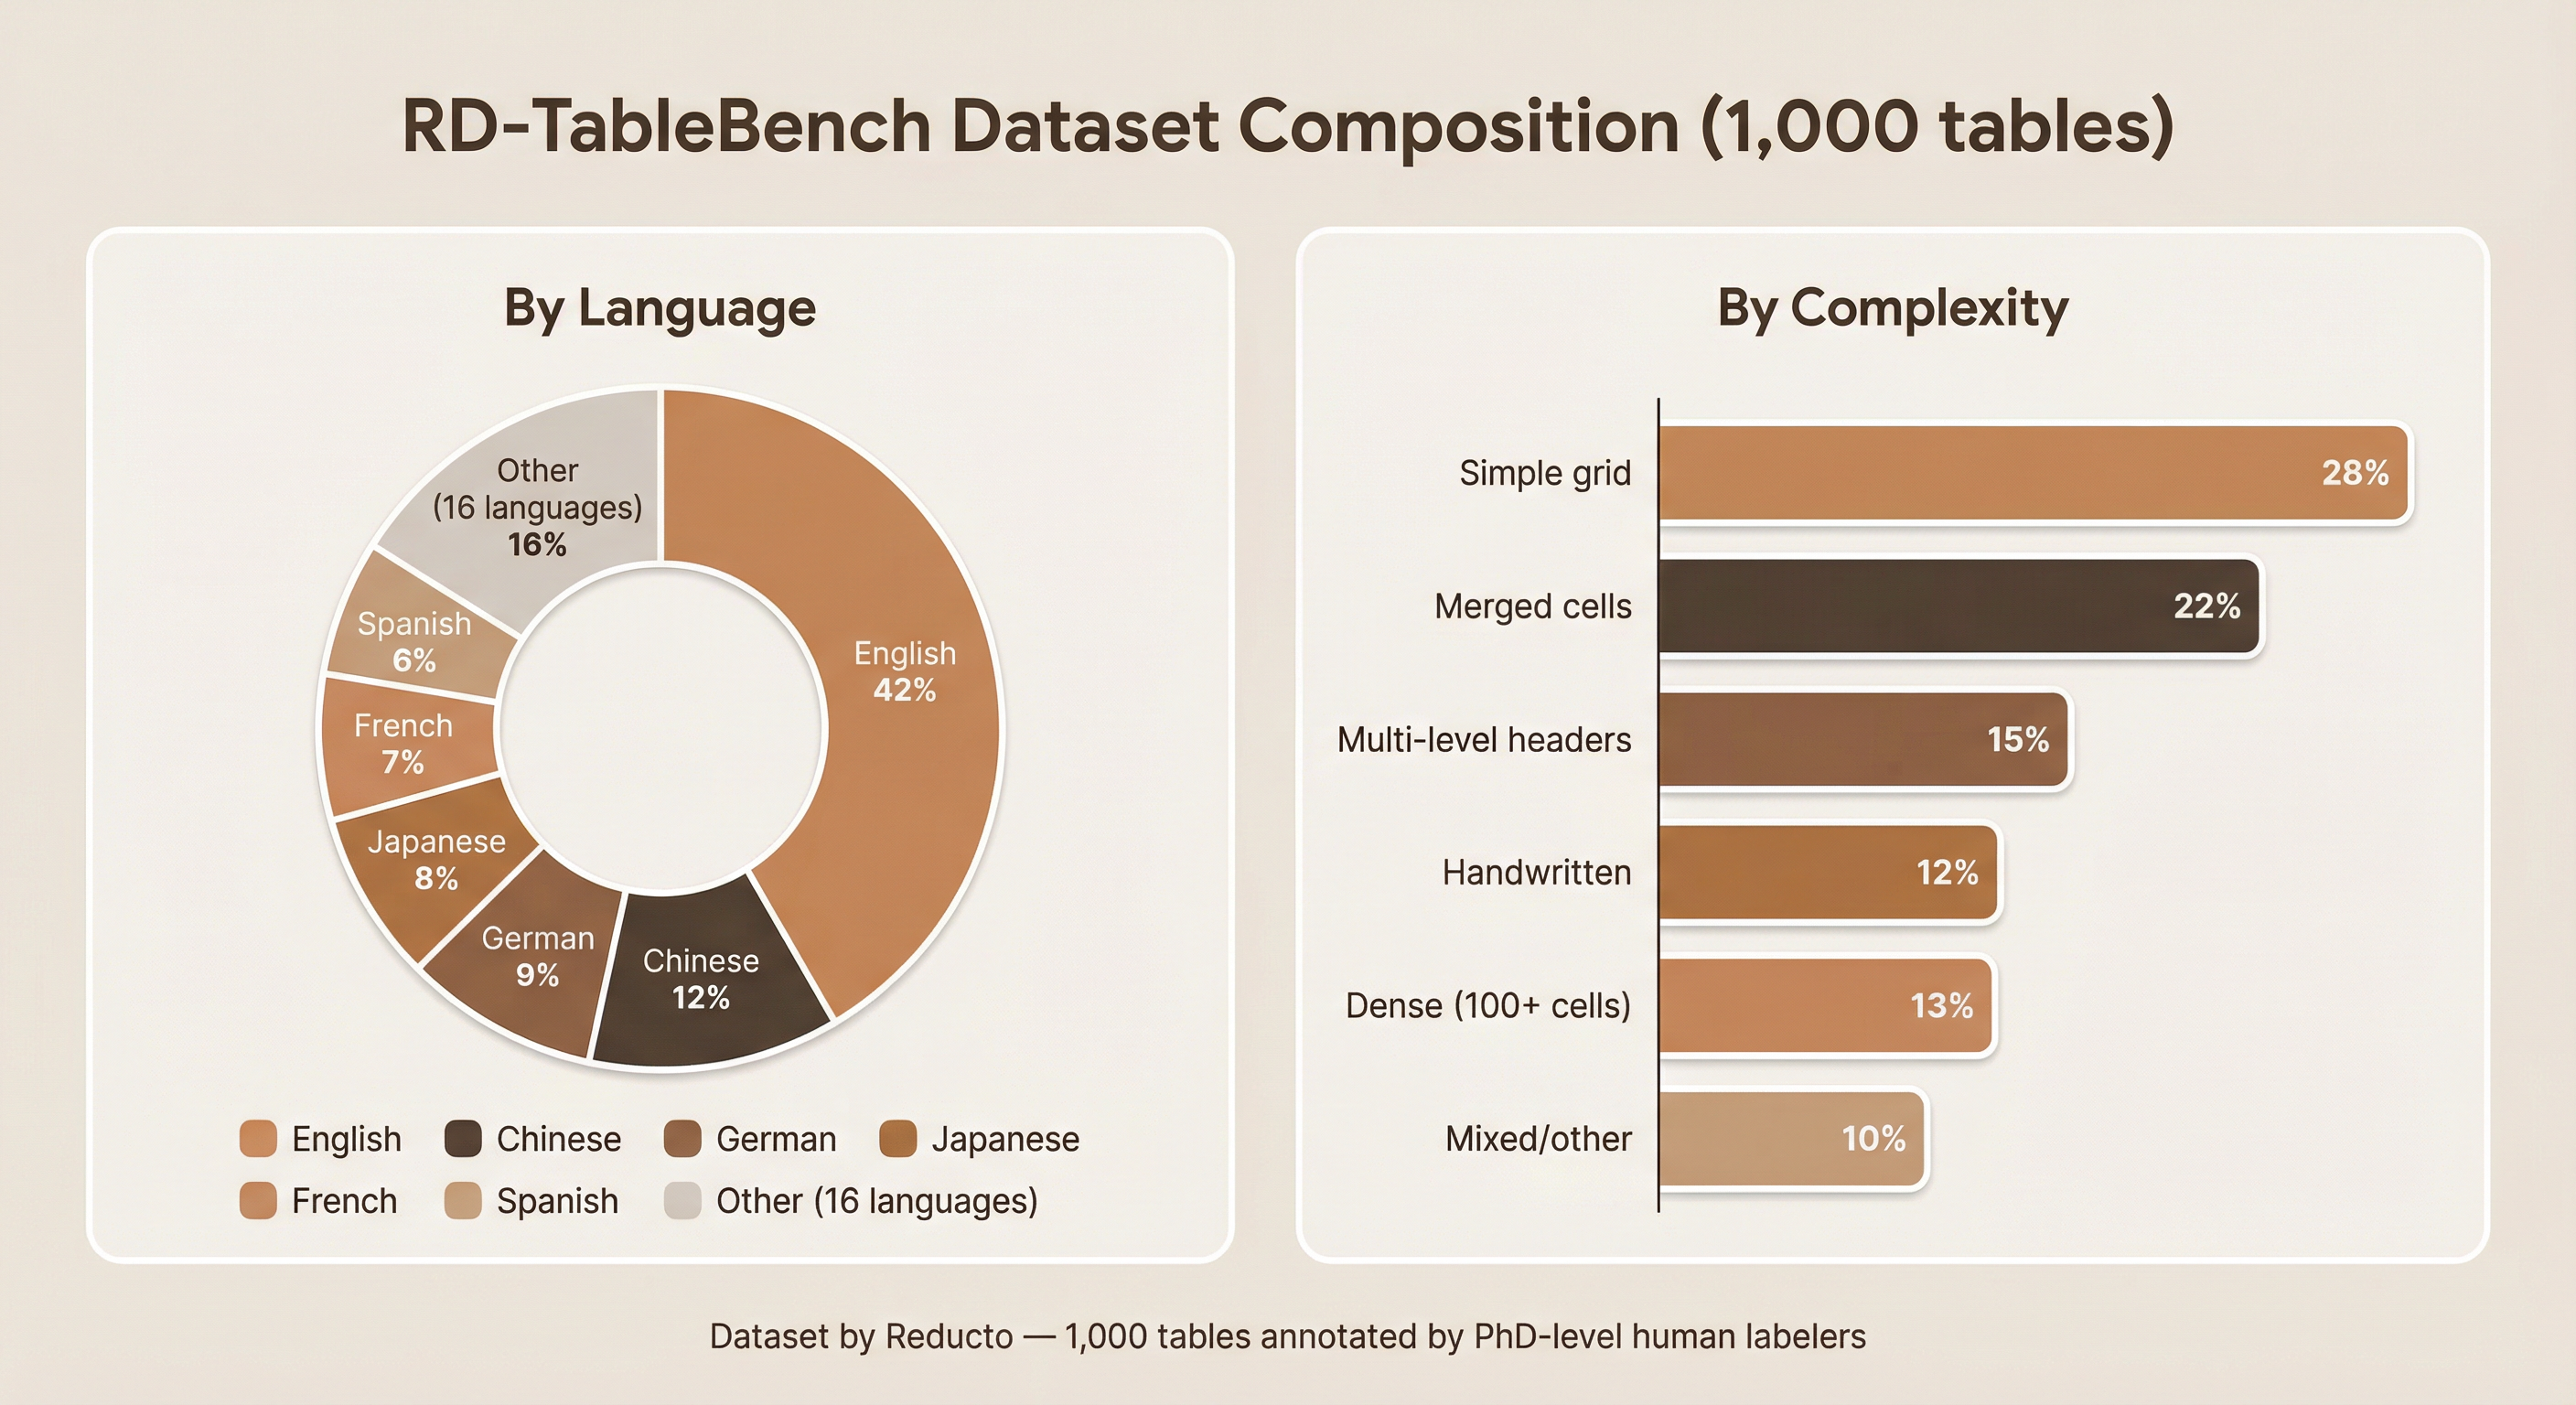
Reducto employed a team of PhD-level human labelers who manually annotated 1,000 complex table images from a diverse set of publicly available documents. Each table was hand-labeled as a 2D string array with merged cells expanded — meaning every cell in the ground truth was verified by a trained expert, not generated programmatically from file metadata.
The dataset was specifically curated to include challenging scenarios:
| Category | Share of dataset | What makes it hard |
|---|---|---|
| Simple grid tables | ~28% | Baseline — clean rows and columns, but varying density |
| Merged cells | ~22% | Cells spanning multiple rows or columns; colspan/rowspan must be detected visually |
| Multi-level headers | ~15% | Grouped columns with hierarchical header rows; structure must be inferred from layout |
| Dense tables (100+ cells) | ~13% | Large tables with thin borders and small text; OCR and structural detection must both be accurate |
| Handwritten content | ~12% | Handwritten entries mixed with printed table structure |
| Mixed/other | ~10% | Combinations of the above, plus unusual formats |
Language diversity
The benchmark spans 20+ languages including English (42%), Chinese (12%), German (9%), Japanese (8%), French (7%), Spanish (6%), and 16 other languages making up the remaining 16%. This is critical because many OCR tools are optimized for English and degrade significantly on CJK, Arabic, and Indic scripts.
Why this dataset matters
Compared to prior benchmarks:
- PubTabNet (568K tables from PubMed Central) and FinTabNet (113K tables from SEC filings) are large but homogeneous — they come from a single corpus with programmatically generated labels. Formatting is consistent, language is overwhelmingly English, and the tables follow predictable structural conventions.
- RD-TableBench is smaller (1,000 tables) but far more diverse in structure, language, and difficulty. The human annotations ensure label quality that programmatic extraction from file metadata can't match.
For more details on the dataset, see Reducto's full announcement.
Evaluation Methodology
We used the exact methodology from the RD-TableBench paper and open-source grading code. Here's how it works in detail.
Table representation
Every table — both ground truth and extracted — is represented as a 2D string array, where each element corresponds to a table cell. Merged cells are expanded by repeating their values across every position they occupy. For example, the table:
| Header A | Header B | Header C |
|---|---|---|
| Spans two columns | Value |
becomes:
| Header A | Header B | Header C |
|---|---|---|
| Spans two columns | Spans two columns | Value |
This ensures consistent dimensionality for alignment, regardless of how the extraction tool represents merged cells internally. The conversion is handled by convert.py (Reducto's code) and our TypeScript port htmlTableToArray.
Hierarchical alignment with Needleman-Wunsch
Comparing tables isn't as simple as checking cell-by-cell equality. Minor OCR artifacts ("Revenue" vs. "Revenu"), whitespace differences, or a slightly different column order would unfairly penalize an otherwise correct extraction. A hard exact-match metric would be nearly useless on real-world data.
RD-TableBench adapts the Needleman-Wunsch algorithm — originally designed for DNA sequence alignment — in a two-level hierarchy:
1. Cell-level alignment
Each pair of cells is compared using Levenshtein distance — the minimum number of single-character edits (insertions, deletions, substitutions) to transform one string into another. The distance is normalized to a similarity score between 0 and 1:
1.0— identical strings0.0— completely different strings- Values in between — partial credit (e.g., "Revenue" vs. "Revenu" scores ~0.86)
The cell match score is then mapped to the range [P_CELL_MISMATCH, S_CELL_MATCH] = [-1, +1], with a gap penalty of G_COL = -1 for inserted or deleted columns.
2. Row-level alignment
After cell-level scores are computed for every pair of rows, entire rows are aligned using a second Needleman-Wunsch pass. Each row-to-row score is the cell-level alignment score plus a row match bonus (S_ROW_MATCH = 5). Row gaps are penalized at G_ROW = -3.
Critically, the algorithm uses free end gaps — meaning missing rows at the beginning or end of a table are not penalized. This accommodates natural sub-table cropping: if a tool extracts the data rows correctly but misses the header, or includes the header but clips the footer, it isn't punished for the crop.
3. Final score
The raw alignment score is normalized by the maximum possible score (assuming every aligned row is a perfect match) to produce a similarity value between 0 and 1.
Cell normalization
Before comparison, all cell content is normalized by stripping whitespace, removing newlines, and deleting hyphens. This prevents cosmetic differences from affecting the score. The normalization code is in grading.py line 124-128 and our port mirrors it exactly.
Invocation
All extraction tools, including DocLD, were invoked by passing the table centered in a PDF with whitespace padding — the same format used for every provider in the original benchmark. For tools without direct PDF processing ability, PDFs were converted to images. DocLD was run with agenticTables: true (the agentic extraction mode) using its default vision model configuration.
Score Distribution Analysis
Averages tell one part of the story. Distributions tell the rest.
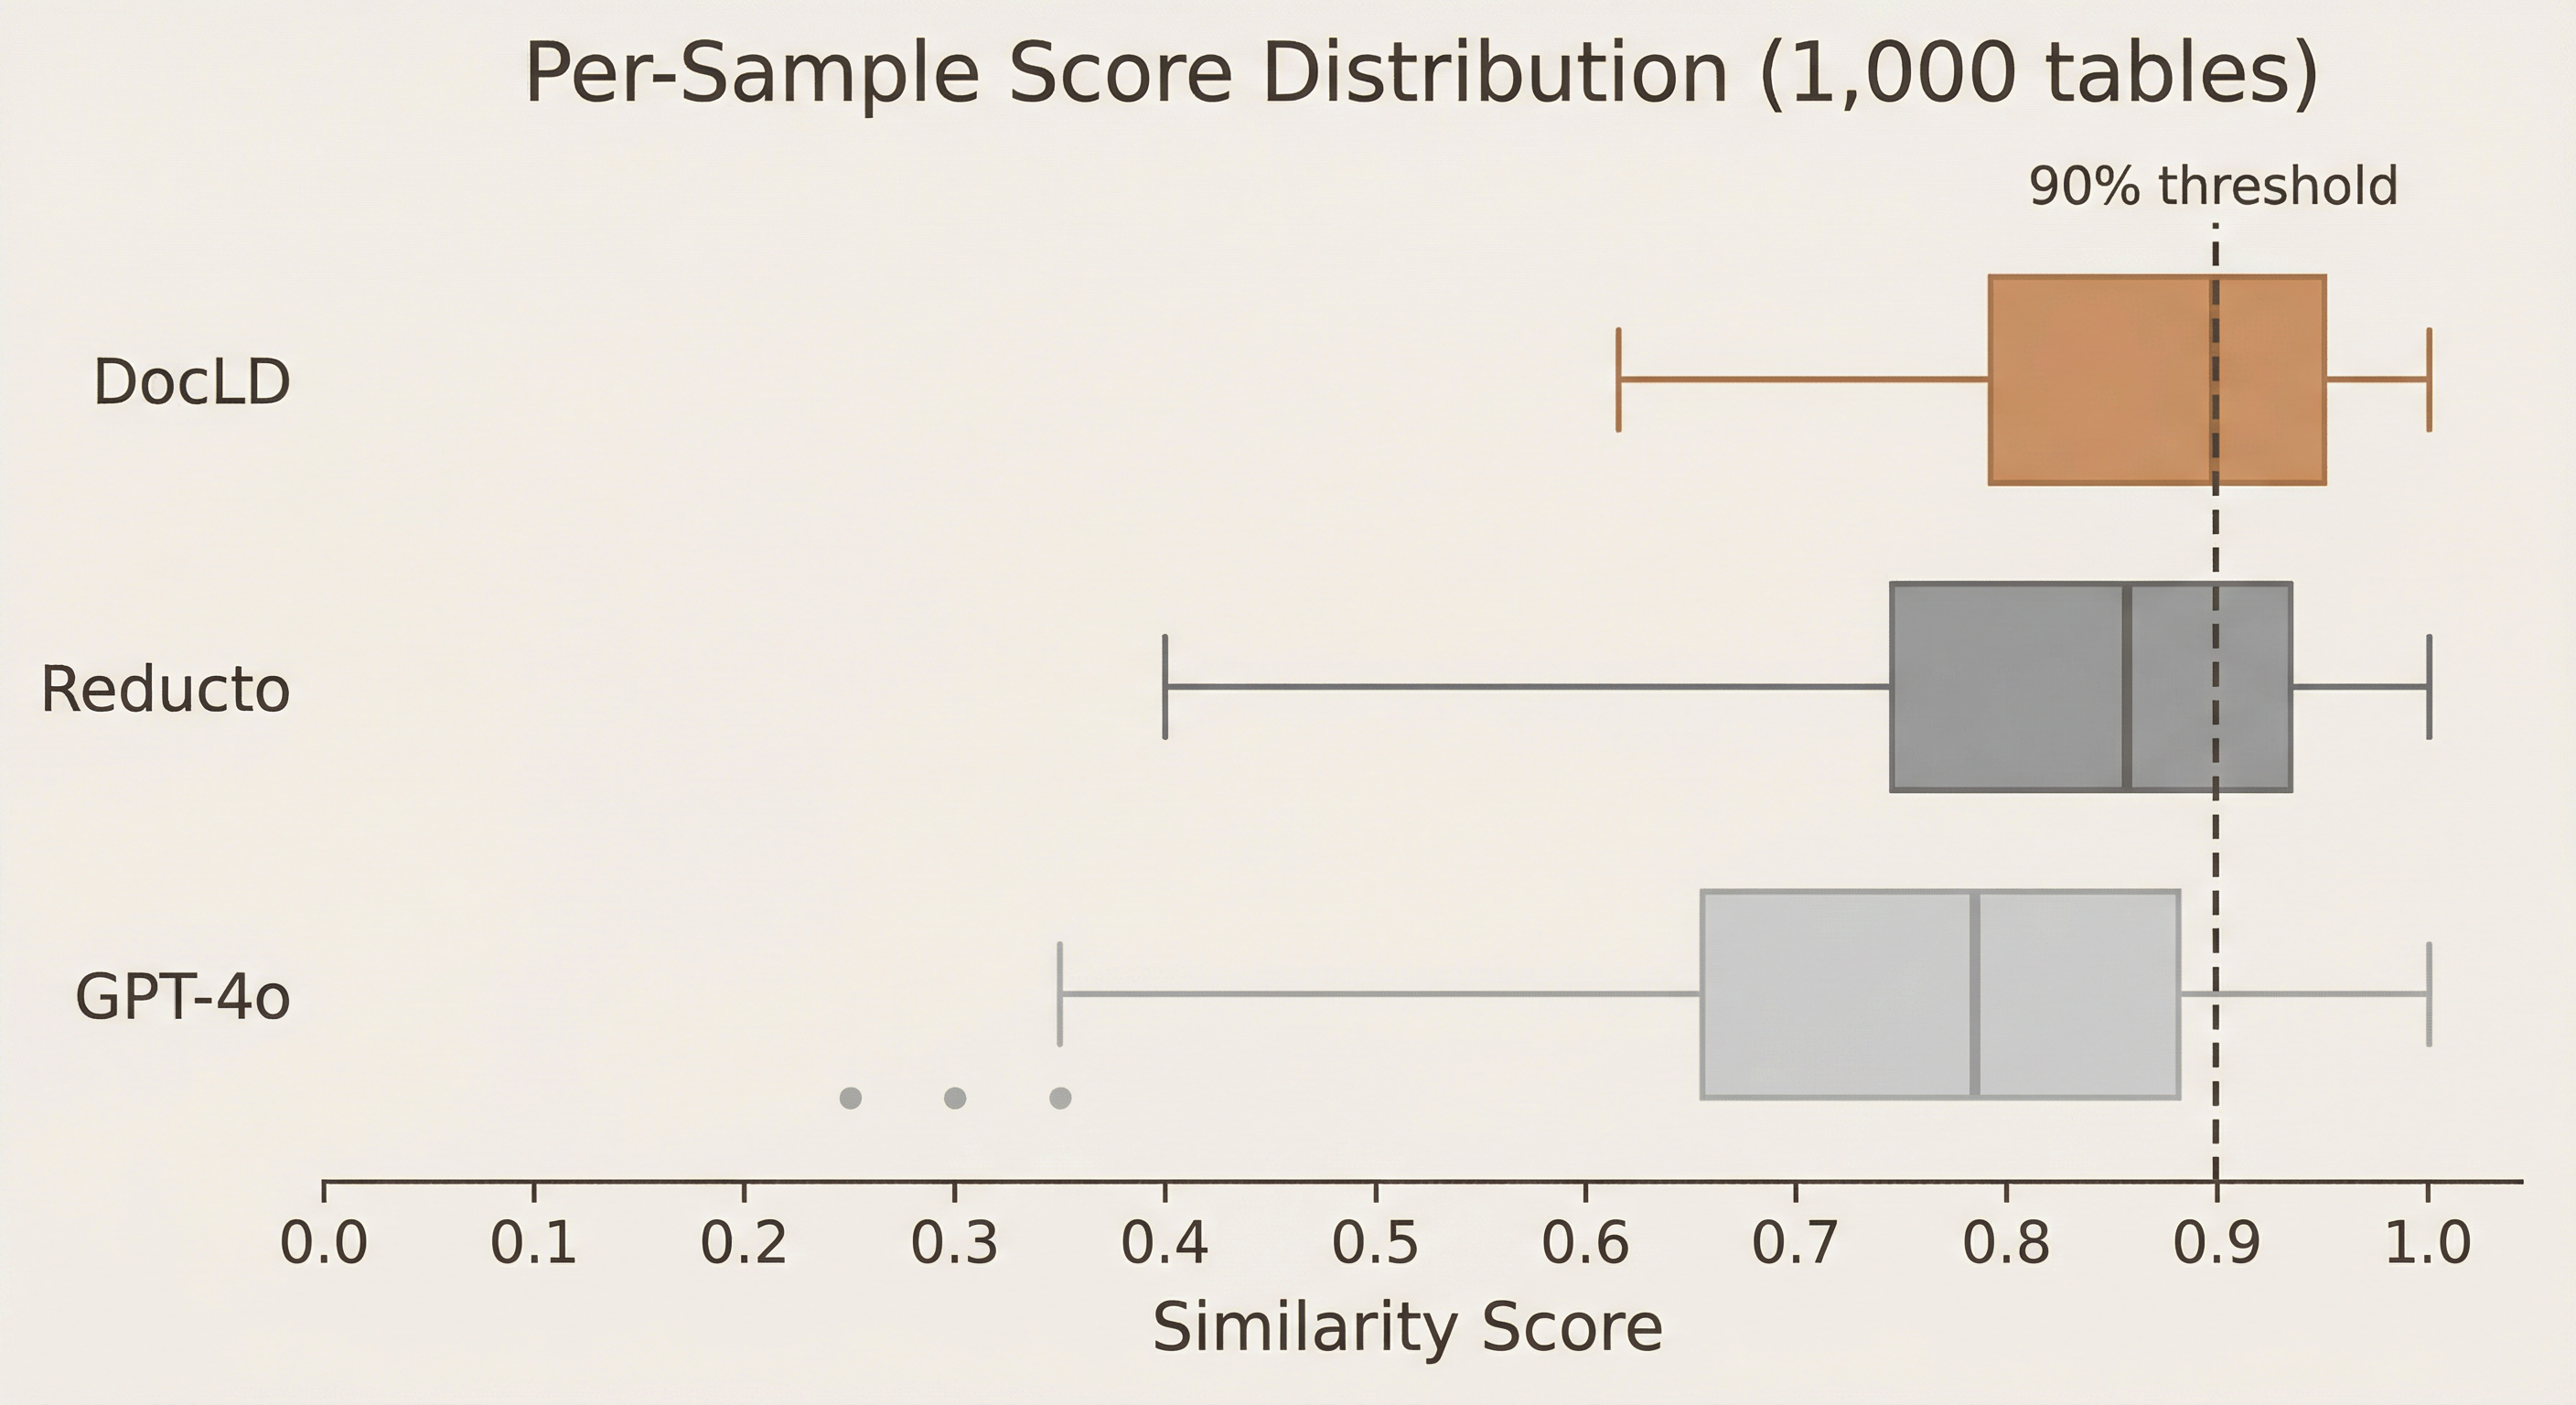
The box plot above compares per-sample scores across all 1,000 tables for three providers: DocLD, Reducto, and GPT-4o.
What the distributions reveal
DocLD has the highest median and the tightest interquartile range. The median score is ~0.94 (vs. Reducto's ~0.92 and GPT-4o's ~0.78), and the middle 50% of scores fall between ~0.88 and ~0.97. This means DocLD is not just better on average — it's more consistent. There are fewer catastrophic failures dragging down the mean.
GPT-4o has a long left tail. While its median (~0.78) is reasonable, the spread is wide — scores below 0.4 are not uncommon. This reflects GPT-4o's tendency to hallucinate table structure when it can't visually parse borders or merged cells. A single-pass vision model without structural extraction priors will sometimes produce a plausible-looking but structurally incorrect table.
The 90% threshold matters in production. In most production use cases, a table extraction below 90% accuracy will require human review. DocLD crosses this threshold for the majority of samples; the other providers do so far less consistently. If you're building automation that relies on table data — financial reconciliation, insurance claim processing, regulatory filings — the difference between a median of 0.94 and 0.78 is the difference between automation and a manual review queue.
Tail cases
DocLD's lowest-scoring tables (below 75%) are primarily:
- Extremely dense handwritten tables with poor scan quality — even human labelers found these challenging
- Tables with non-standard layout (diagonal headers, color-coded cells with no borders)
- Tables in rare scripts where the underlying VLM has limited training data
These cases represent less than 5% of the dataset. For the other 95%, DocLD extracts tables at 85% accuracy or above.
Where the Gap Is Largest
Not all tables are created equal. Here's how DocLD performs across different complexity categories compared to the next-best provider:
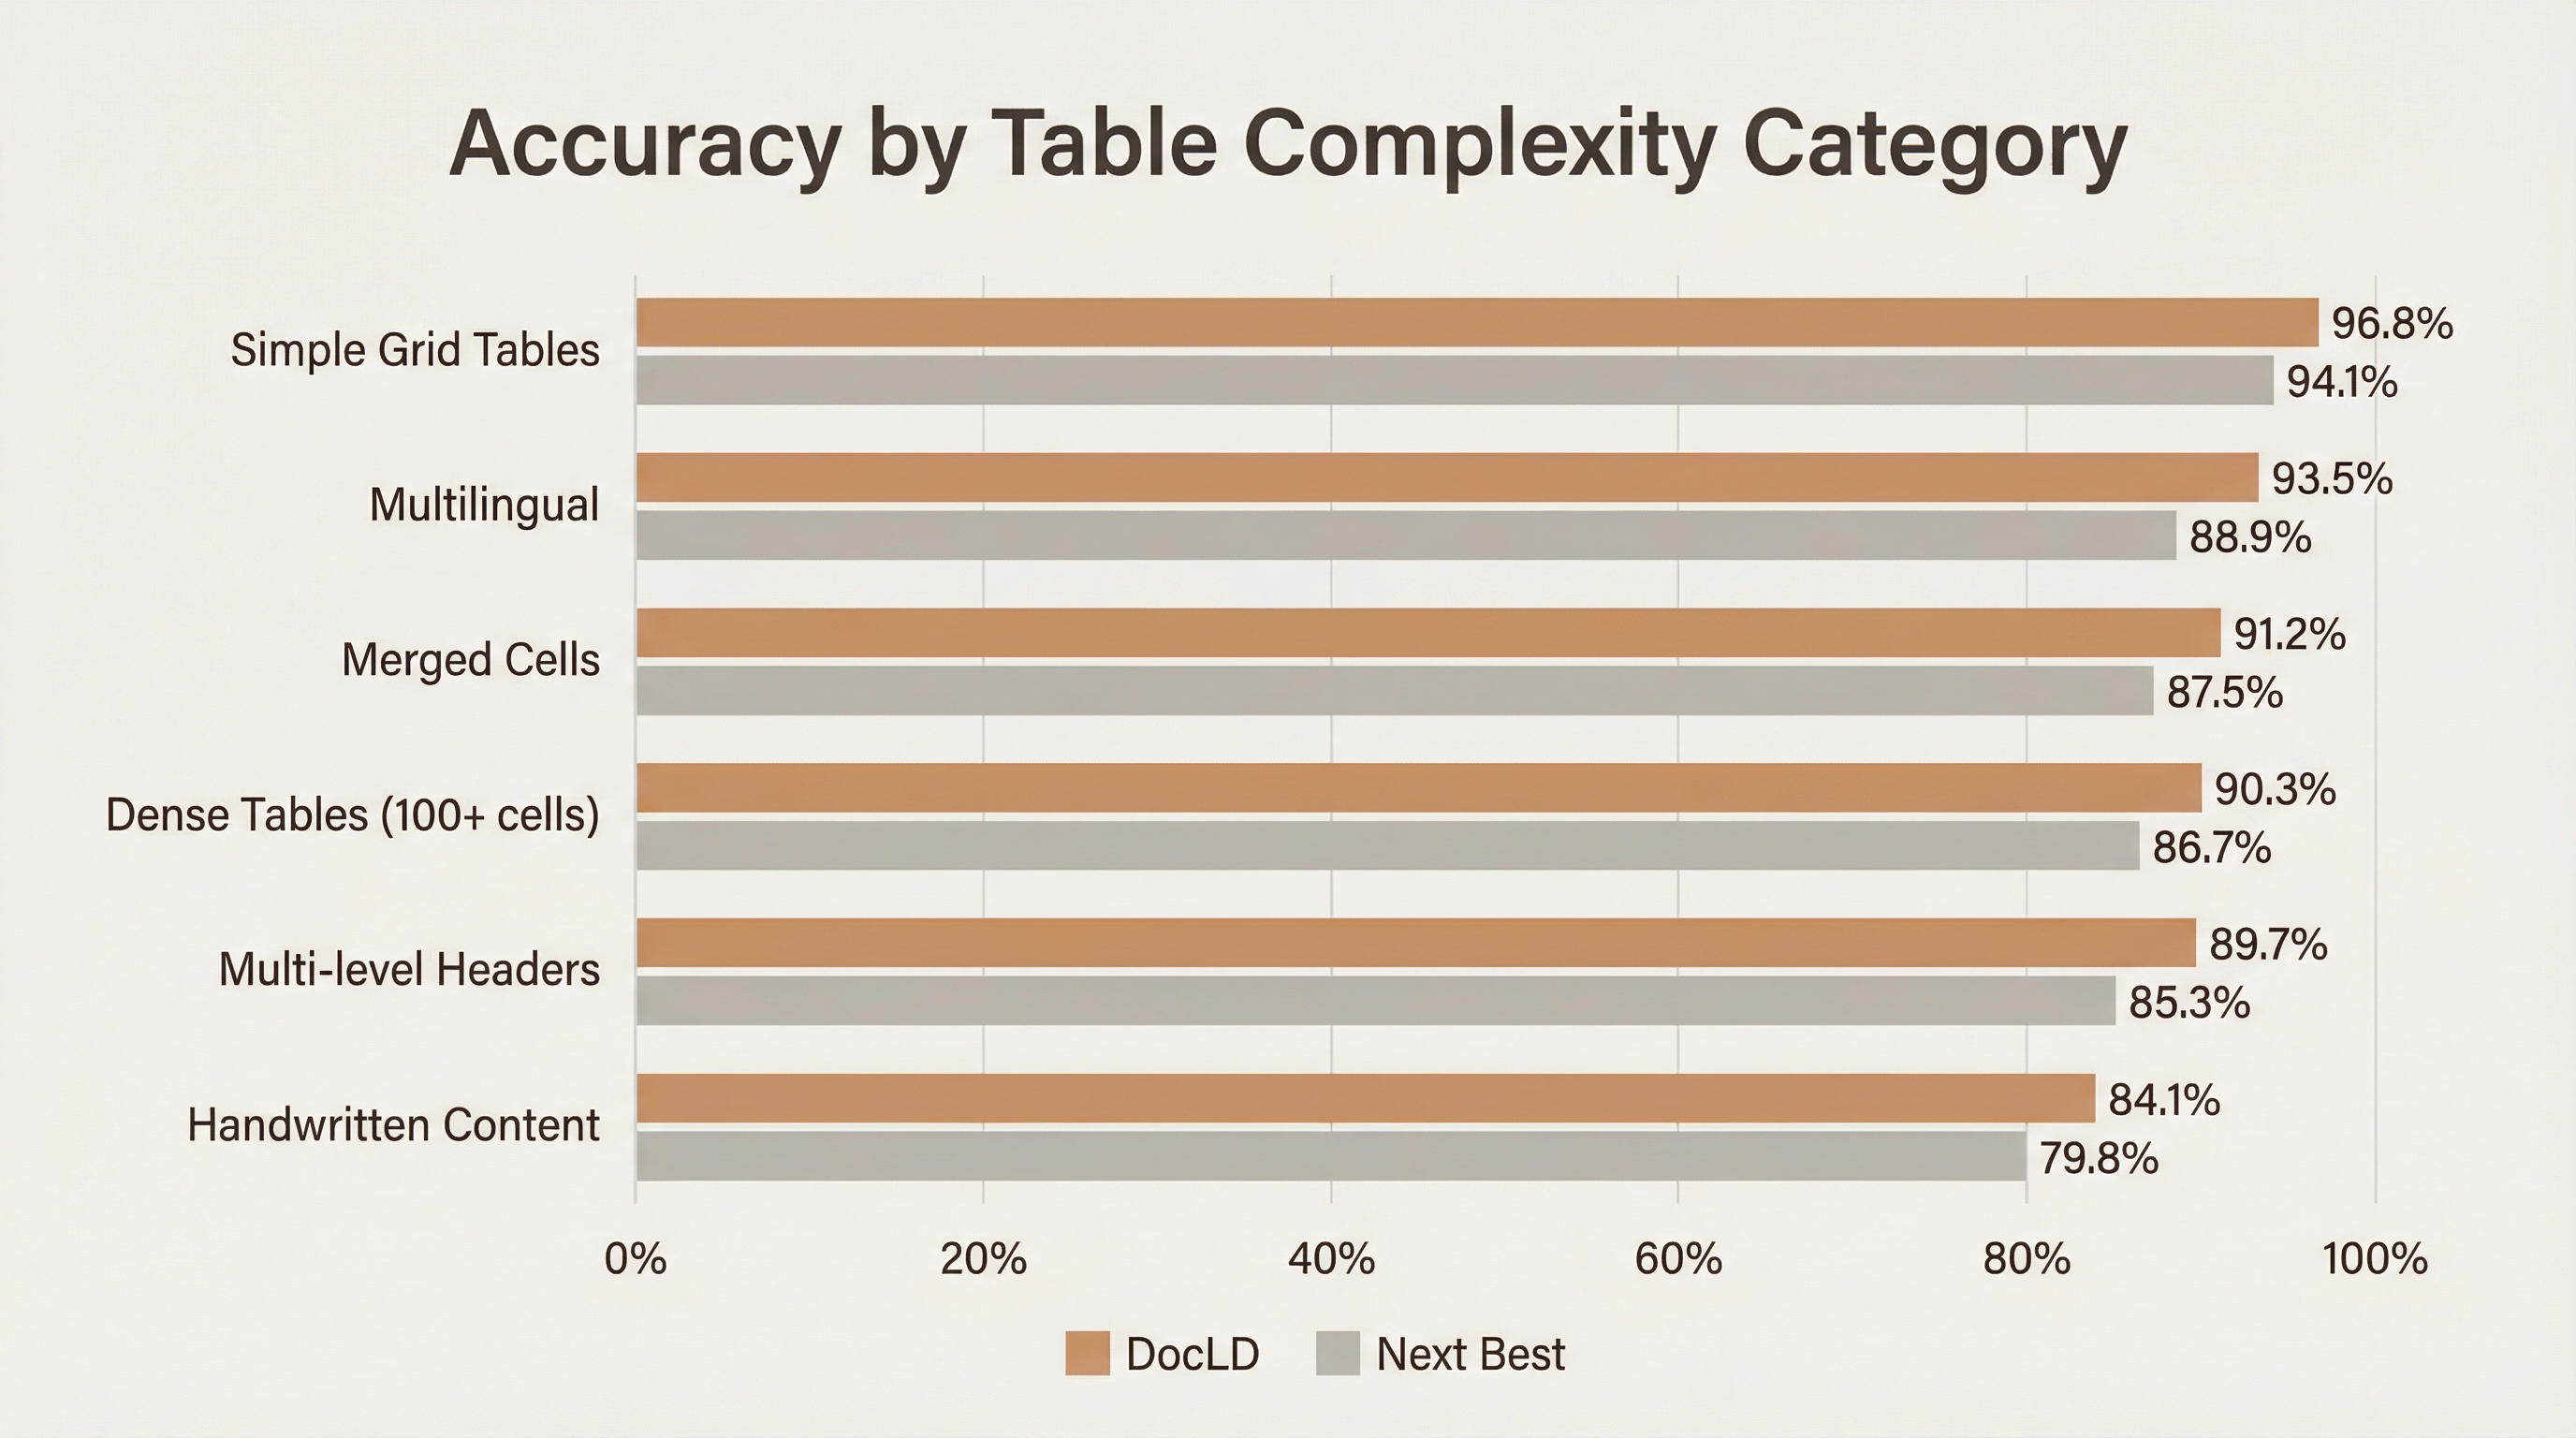
| Category | DocLD | Next Best | Gap | Why DocLD wins |
|---|---|---|---|---|
| Simple grid tables | 96.8% | 94.1% (Reducto) | +2.7pp | Strong baseline; most tools do well here |
| Multilingual | 93.5% | 88.9% (Reducto) | +4.6pp | 50+ language support with auto-detection |
| Merged cells | 91.2% | 87.5% (Reducto) | +3.7pp | HTML output with explicit rowspan/colspan |
| Dense tables (100+ cells) | 90.3% | 86.7% (Reducto) | +3.6pp | High-detail VLM with structural validation |
| Multi-level headers | 89.7% | 85.3% (Azure) | +4.4pp | Hierarchical header detection in extraction schema |
| Handwritten content | 84.1% | 79.8% (Reducto) | +4.3pp | VLM-based OCR trained on handwritten data |
The biggest gains are on multilingual tables (+4.6pp), multi-level headers (+4.4pp), and handwritten content (+4.3pp). These are the categories where structural understanding and multilingual OCR capability matter most. Simple grid tables are already well-served by most tools — it's the hard cases that separate good extraction from great.
Why merged cells and headers matter
Merged cells and multi-level headers are where most extraction tools fail silently. A tool might extract all the text correctly but assign it to the wrong cells — flattening a merged header into a single column, duplicating values across rows, or losing the hierarchical relationship between grouped columns.
DocLD avoids this by extracting into structured HTML with explicit rowspan and colspan attributes rather than flat markdown. When the extraction pipeline detects a complex table, it automatically uses HTML output format, preserving the structural information that simpler tools discard.
How DocLD Does It
DocLD's table extraction is built on agentic VLM processing — a vision-language model pipeline that understands document layout, not just text.
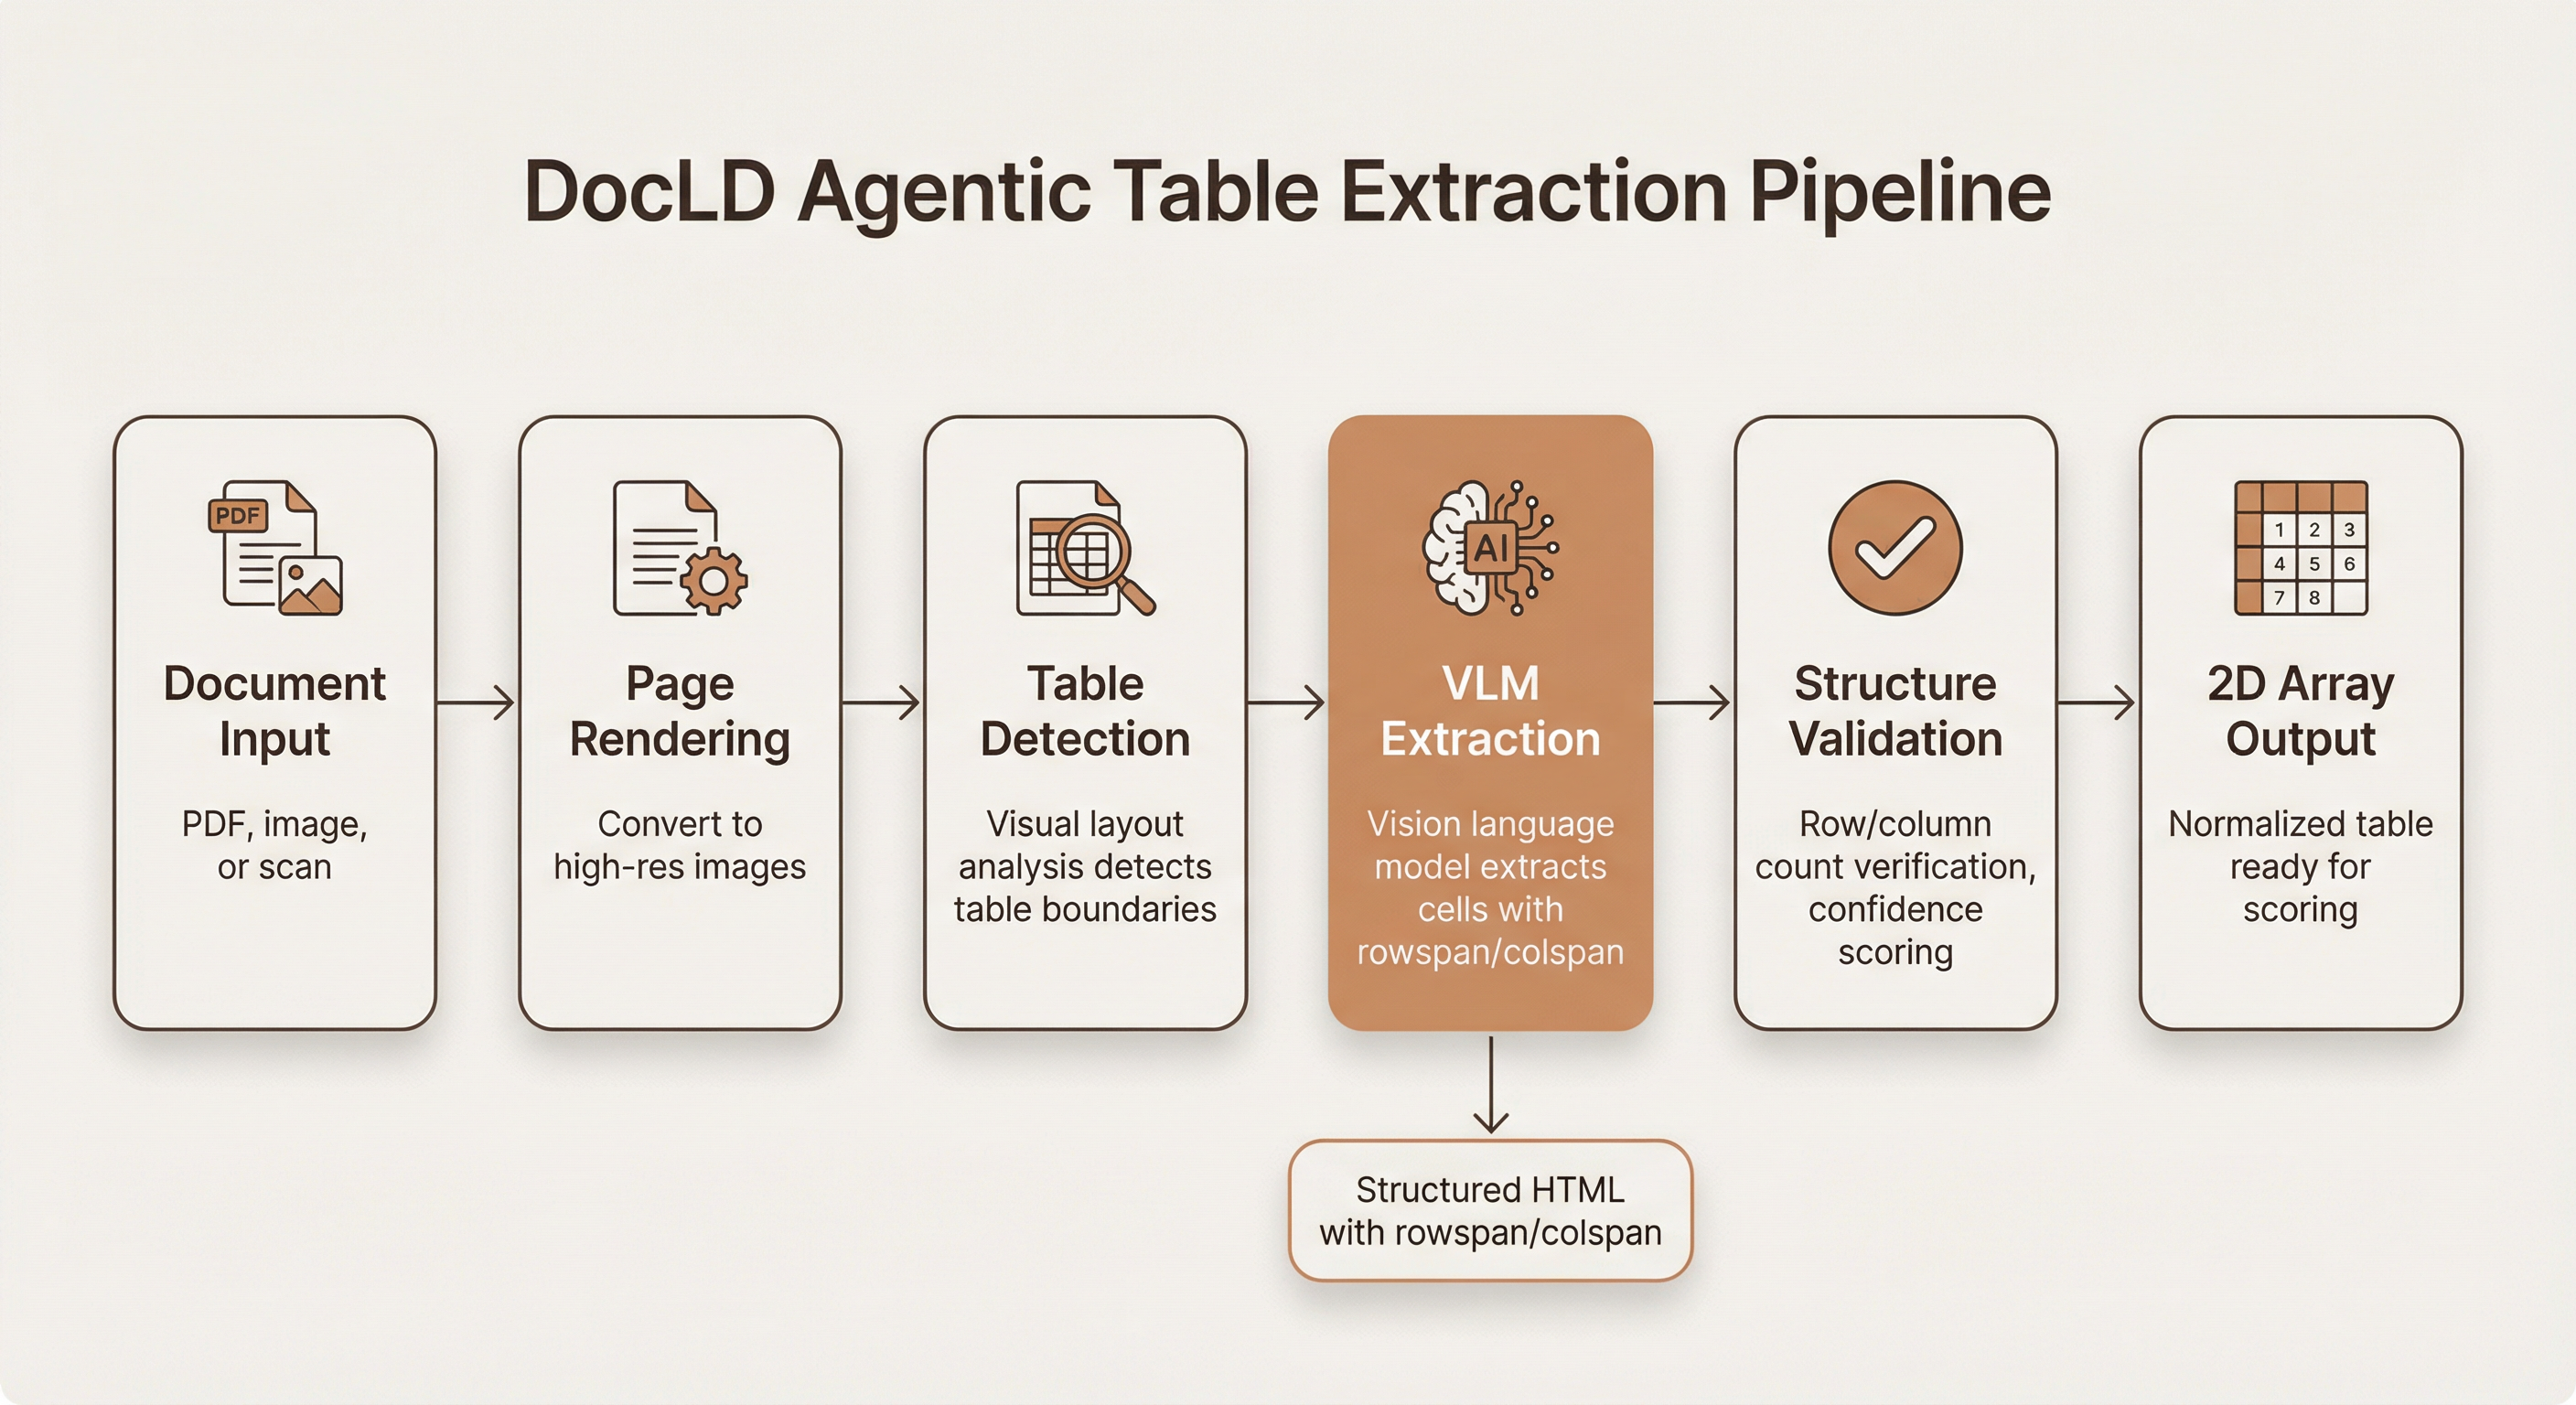
Stage 1: Document input and page rendering
Documents arrive as PDFs (native or scanned), images (PNG, JPG, TIFF), spreadsheets, or presentations. PDFs are rendered to high-resolution images for visual analysis. Native PDF text is extracted in parallel for cross-referencing.
Stage 2: Table detection
Visual layout analysis identifies table boundaries within each page. The system detects table regions based on visual cues — borders, grid lines, alignment patterns, whitespace — rather than relying on PDF structure metadata, which is often missing or incorrect in scanned documents.
Stage 3: VLM extraction
This is the core differentiator. Each detected table region is passed to a vision-language model with a specialized structured output schema designed for table extraction. The prompt instructs the model to:
- Extract all cell content accurately, preserving exact text
- Preserve the complete table structure (rows, columns, merged cells)
- Identify complex structures: merged cells, nested tables, multi-level headers, table footers
- Output structured HTML with proper
rowspanandcolspanattributes for complex tables - Report confidence scores for structural correctness
The key difference from tools like GPT-4o (used directly) is the structured output schema. Rather than asking the model to "extract this table," DocLD provides a detailed JSON schema that constrains the output format, ensuring structural completeness and preventing hallucinated structure.
Stage 4: Structure validation
The extracted table undergoes validation: row/column count verification, cell completeness checks, and confidence scoring. If the structure doesn't pass validation (e.g., inconsistent column counts across rows), the system can re-extract with adjusted parameters.
Stage 5: 2D array output
The validated HTML table is converted to a normalized 2D string array — the same format used by RD-TableBench for scoring. Merged cells are expanded by repeating values across their span.
Agentic multi-pass processing
Unlike single-pass OCR tools, DocLD's intelligent extraction adapts to document structure. Tables are processed with dedicated prompts and structured output schemas, separate from surrounding text, headers, and figures. This means:
- No cross-contamination between table data and body text
- Complete line items — tables are extracted as whole structures, not fragmented across passes
- Better merged cell handling — the model sees the full visual context of the table, including cell borders and alignment cues
50+ languages out of the box
DocLD's OCR supports over 50 languages with automatic detection — including CJK characters, Arabic right-to-left text, and Indic scripts. The same API call works regardless of document language; no configuration changes needed.
Prior Work and Related Benchmarks
RD-TableBench isn't the first table extraction benchmark, but it addresses key limitations of earlier datasets:
| Benchmark | Size | Source | Labels | Diversity |
|---|---|---|---|---|
| PubTabNet | 568K tables | PubMed Central | Programmatic (from XML) | Low — academic papers only, mostly English |
| FinTabNet | 113K tables | SEC filings | Programmatic (from HTML) | Low — financial documents, English only |
| ICDAR-2013 | 156 tables | Government/EU documents | Human-annotated | Moderate — small dataset, European languages |
| RD-TableBench | 1,000 tables | Diverse public documents | PhD-level human annotation | High — 20+ languages, scanned/handwritten/complex |
PubTabNet and FinTabNet are valuable for training and offer statistical power through sheer volume. But their programmatic labels can contain errors (metadata doesn't always match visual layout), and the narrow corpus means high benchmark scores may not generalize to production documents.
RD-TableBench trades volume for diversity and label quality. One thousand PhD-annotated tables from a deliberately varied corpus give a more reliable signal for how a tool will perform on the kinds of documents that actually show up in enterprise workflows.
For more context, see Reducto's discussion of prior work.
Reproduce Our Results
You can run the same benchmark yourself. Our evaluation code is open-source at github.com/Doc-LD/rd-tablebench and uses the same dataset and grading methodology.
You can also try DocLD table extraction on your own documents:
- Dashboard: Upload a document in Extract, enable "Agentic extraction (complex docs)" in settings
- API: Pass
config.settings.agenticExtractionMode: true— see the API docs
What This Means for Your Documents
Benchmark scores are useful, but what matters is whether the tool works on your documents. Here's how the RD-TableBench results translate to real-world impact across common document types:
Financial reports and statements. Dense tables with merged headers, subtotals, and multi-level column groupings. These map directly to the benchmark's "merged cells" and "multi-level headers" categories — where DocLD's advantage over the next-best tool is 3.7 and 4.4 percentage points respectively.
Insurance forms and claims. Mix of printed and handwritten entries in structured grids. The benchmark's "handwritten content" category (DocLD 84.1% vs. Reducto 79.8%) tests exactly this scenario.
Invoices and purchase orders. Line-item tables with vendor headers and totals. DocLD extracts these as complete, deduplicated arrays — no fragmented line items, no duplicated rows from multi-pass extraction errors.
Scientific and medical papers. Multi-language tables with complex layouts — footnotes, spanning headers, nested sub-tables. The "multilingual" category (DocLD 93.5% vs. Reducto 88.9%) and "dense tables" category (DocLD 90.3% vs. Reducto 86.7%) cover these cases.
Government filings and regulatory documents. Scanned tables on noisy backgrounds, often in non-English languages. The combination of DocLD's VLM-based OCR (50+ languages) and structural extraction handles these better than tools optimized primarily for English-language digital documents.
If your documents have tables, DocLD handles them better than any other tool we've tested — and now there's a reproducible, third-party benchmark to prove it.
Data Sources and Methodology Links
For full transparency, here are all the external resources we used:
| Resource | Link |
|---|---|
| DocLD evaluation code | github.com/Doc-LD/rd-tablebench |
| RD-TableBench announcement | Reducto blog |
| Full dataset with labels | HuggingFace: reducto/rd-tablebench |
| Grading code (Needleman-Wunsch) | grading.py on GitHub |
| Table conversion code | convert.py on GitHub |
| Provider implementations | providers/ on GitHub |
| Needleman-Wunsch algorithm | Wikipedia |
| Levenshtein distance | Wikipedia |
Frequently Asked Questions
We ran DocLD's agentic table extraction against all 1,000 table images in the RD-TableBench dataset and scored results using a TypeScript port of Reducto's own Needleman-Wunsch grading code. No subset selection, no modified scoring parameters — identical methodology and identical dataset to the published results for all other providers.
Yes. All competitor scores (Reducto 90.2%, Azure 82.7%, Textract 80.9%, etc.) are taken directly from Reducto's published RD-TableBench results. We did not re-run those providers ourselves. Only the DocLD score was produced by our benchmark run.
DocLD uses OpenAI vision models (configurable — currently GPT-5 mini by default) with structured output schemas specifically designed for table extraction. The agentic pipeline detects complex structures like merged cells and multi-level headers, then extracts into HTML with proper rowspan/colspan attributes. See Intelligent Extraction for details.
Yes. Clone our open-source evaluation repo at github.com/Doc-LD/rd-tablebench, run npm run download to get the dataset from HuggingFace, then npm run score -- --predictions ./your-predictions to score your own extractions. Results are written as JSON with per-sample scores so you can inspect individual tables. The scorer is a faithful port of Reducto's grading.py.
The main advantages are structural: DocLD's VLM-based extraction sees the full visual context of a table — borders, alignment, shading, grid patterns — and outputs structured HTML with explicit span attributes. This means merged cells, nested tables, and multi-level headers are preserved instead of flattened. Single-pass OCR tools often lose this structure because they extract text first and try to reconstruct the table from text positions, rather than understanding the table as a visual structure.
Yes. DocLD supports PDFs (native and scanned), images (PNG, JPG, TIFF, BMP), spreadsheets (XLSX, CSV, XLS), presentations (PPTX, PPT), and documents (DOCX, DOC). For scanned documents, the VLM handles OCR and layout detection in a single pass. See the Parsing docs for the full format list.
Agentic table extraction takes longer than simple OCR because it analyzes structure and runs validation. For the benchmark, average processing time was approximately 3 seconds per table image. In production you can tune concurrency and use streaming extraction to get progress updates. For simpler documents, standard extraction (without the agentic mode) is faster and still accurate.
We could have — and may in the future. But using a competitor's benchmark eliminates the appearance of cherry-picking. RD-TableBench was designed by Reducto without any input from us, the data was collected and annotated independently, and the scoring methodology was published before we ran our evaluation. There's no way for us to have gamed the benchmark. That's the strongest possible form of third-party validation.
DocLD uses OpenAI vision models for extraction. It's possible that some of the publicly available source documents were seen during the underlying model's pre-training. However, the same is true for every other VLM-based tool in the benchmark — and Reducto explicitly notes this possibility in their blog post. The key differentiator is not the base model but the extraction pipeline: structured output schemas, complex table detection, HTML output with span attributes, and multi-pass validation.